Options Pricing
Volatility, Smiles and Skews
This lesson delves into the concepts of volatility smiles and skews, phenomena observed in the options market that indicate deviations from the Black-Scholes model's assumptions. Understanding these patterns is crucial for options traders, as they provide deeper insights into market dynamics.
We saw the volatility parameter $\sigma$ came from wanting to tailor the variance of the terminal probability distribution to specific assets in the section on normal models. Volatility represents the degree of variation in the price of the underlying asset over time, essentially measuring the asset's price fluctuations. It plays an important role in determining the price of an option in the Black-Scholes model, where it is known as `implied volatility' - the market's forecast of the asset's future volatility. The Black-Scholes model assumes that the volatility parameter is constant over the life of the option. In reality, market volatility tends to fluctuate over time due to various economic and geopolitical factors. This discrepancy causes mismatches between model predictions and actual option prices. It is also assumed that implied volatility is constant across strike prices, and that the logarithmic returns of the underlying assets, defined as $$ r_{\text{log}} = \log \left( \frac{S_{t}}{S_{t-\tau}} \right) $$ are normally distributed. In practice, implied volatility is a function of strike price, with the tendency for the implied volatility to increase for options that are deeply in or out of the money. To understand why, consider that the empirical probability distribution of returns on assets has fat tails - that is, extreme market movements are more common than a normal distribution would predict. As a result, implied volatility is higher when the option is deeply in or out of the money because extreme market events occur more frequently than what the Black-Scholes model predicts. Since the tails of a normal distribution decay exponentially towards zero and fat tails tend to decay much more slowly (usually according to some power law), implied volatility increases as the spot price moves away from the strike price. This phenomenon is known as a volatility smile.
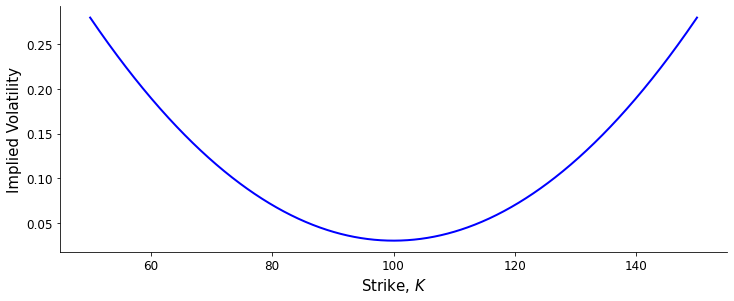
Diagram of the volatility smile
Typically, volatility curves are constructed using an average of calls and puts, and the increased implied volatility on the extremes of the volatility smile comes from the increased implied volatility of the out-of-the-money option. So, the left side of the smile is increased due to the implied volatility of out-of-the-money puts more than in-the-money calls. Similarly, the right side of the smile is increased due to the implied volatility out-of-the-money calls more than in-the-money puts. Sometimes, the implied volatility can be skewed towards one size, indicating that the market has higher expectations of price movements in one direction. A negative skew is a volatility curve in which options with lower strikes have a higher implied volatility than higher strikes. A positive skew is a volatility curve in which options with higher strikes have a higher implied volatility than lower strikes.
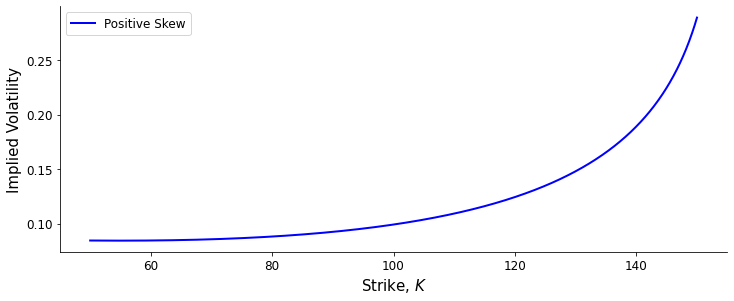
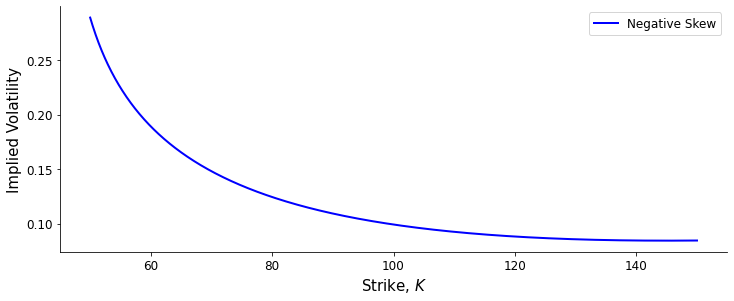
Positive and negative volatility skews
Equities, such as stocks and shares, often have a volatility surface with a negative skew, where put options that are out-of-the-money have a higher implied volatility than at-the-money and in-the-money puts. In this case, markets expect a higher probability that the stock price drops. A stock price could drop for a number of reasons, such as poor earnings reports and negative news. Generally, negative outlier events tend to occur more often than positive outlier events for these assets which causes this volatility profile.
Commodities, such as gold and crude oil, often have a volatility surface with a positive skew, where call options that are out-of-the-money have a higher implied volatility than at-the-money and in-the-money calls. Here, the market is primarily concerned with the commodity spiking in price, which can be caused by supply disruptions and geopolitical events. Generally, the market expects outlier events which positively affect the price to occur more frequently than outlier events which negative affect the price of commodities.